Tracking PostgreSQL execution plans is an important metric for enhancing PostgreSQL performance. In an earlier tutorial discussing pg_stat_statements extension, we learned how to track PostgreSQL queries. In this tutorial, we will discuss how to track PostgreSQL execution plans run by the server optimizer with the pg_store_plans module, an extension created by the PostgreSQL community.
The pg_store_plans PostgreSQL extension is a PostgreSQL extension that allows users to store their query execution plans in an easily accessible form. This makes it easy for developers to identify any issues with their queries or to optimize them for better performance.
We will start by setting up the pg_store_plans module and learn how to benefit from this third-party tool. We will then join it with the pg_stat_statements extension and see how powerful both tools can help use boost PostgreSQL performance. Afterwards, we will get insights about what Datasentinel can provide based on this extension and how visualizations will make it easy for developers to track such useful metric.
Setting up pg_store_plans extension
Because this extension is developed by the community, it’s not built-in in PostgreSQL so we need to set it up. First, make sure you’ve installed PostgreSQL. This tutorial demonstrates using PostgreSQL version 12 but feel free to use your desired version.
Then install the server dev for your installed PostgreSQL version through the following command on your terminal:
sudo apt-get install postgresql-server-dev-12
Download the extension source files
There are various versions of the module. You need to know your PostgreSQL version first before you decide which extension you want to use:
| PostgreSQL version | pg_store_plans version | Download file url |
|---|---|---|
| < 10 | 1.3.1 | https://github.com/ossc-db/pg_store_plans/archive/1.3.1.tar.gz |
| >= 10 and < 14 | 1.4 | https://github.com/ossc-db/pg_store_plans/archive/refs/tags/1.4.tar.gz |
| >= 14 | 1.6.1 | https://github.com/ossc-db/pg_store_plans/archive/refs/tags/1.6.1.tar.gz |
In this tutorial, we will download the pg_store_plans version 1.4 as it is aligned with our PostgreSQL version 12.
Compile the extension
Next, go to the directory of the downloaded tar file and unzip it:
tar xvzf pg_store_plans-1.4.tar.gz
and go inside that directory to compile the module:
cd pg_store_plans-1.4
make USE_PGXS=1
sudo make install USE_PGXS=1
Note: You may want to change the suffix of 1.4 to your specific module version.
Modify the postgresql.conf file
After the compilation is successful, find where your PostgreSQL config file locates through the following SQL command:
sudo -u postgres psql -c "SHOW config_file;"
[sudo] password for <username>:
               config_file
-----------------------------------------
 /etc/postgresql/12/main/postgresql.conf
(1 row)
That path shows the config file that you want to change using your desired editor like vim:
sudo vim /etc/postgresql/12/main/postgresql.conf
If you want to keep the pg_stat_statements extension, you can add pg_store_plans to the shared_preload_libraries separated by a comma:
shared_preload_libraries = 'pg_stat_statements,pg_store_plans' # (change requires restart)
Or if you want to omit the pg_stat_statements extension, you can just keep the pg_store_plans between single quotes.
You can also configure some extension’s parameters like the following:
pg_store_plans.log_analyze = false
pg_store_plans.log_timing = false
pg_store_plans.max=1000
pg_store_plans.track=all
pg_store_plans.plan_format=text
pg_store_plans.min_duration=0
pg_store_plans.log_buffers=false
pg_store_plans.log_triggers=false
pg_store_plans.verbose=false
pg_store_plans.save=false
A breakdown of these parameters is as follows:
log_analyzeis set tofalseto only return theEXPLAINoutput, not theEXPLAIN ANALYZEoutputlog_timingis set tofalseto disable recording the actual timings. This may be useful in some systems to prevent the overhead of repeatedly reading the system clock.maxis set to1000to determine the maximum number of plans tracked bypg_store_plans.trackis set toallto track top-level statements and nested statements. This is similar to thepg_stat_statementstrack parameter.plan_formatis set totextto control the format of the execution plan to be in ordinary text representation.min_durationis set to0to be able to log all the plans. This parameter controls the minimum execution time of a query statement that will cause its plan to be logged.log_buffersis set tofalseto only include theEXPLAINoutput, not theEXPLAIN (ANALYZE, BUFFERS)output.log_triggersis set tofalseto include trigger execution statistics in recorded plans.verboseis set tofalseto only include theEXPLAINoutput, not theEXPLAIN VERBOSEoutput.saveis set tofalseto not save plan statistics when the server shuts down.
If you want to dig deeper into the pg_store_plans parameters, you can consult the module page.
Restart PostgreSQL
Now, you can restart PostgreSQL after changing the config file:
sudo systemctl restart postgresql
Create the extension
Then go to your psql or your SQL client and create the extension:
CREATE EXTENSION pg_store_plans;
Verify the extension installation
Finally, you’re ready to use the pg_store_plans extension:
postgres=# SELECT current_database(), extname, extversion from pg_extension where extname ='pg_store_plans';
-[ RECORD 1 ]----+---------------
current_database | postgres
extname          | pg_store_plans
extversion       | 1.4
Check the extension’s parameters
You can also check the extension’s parameters with the following command:
postgres=# SELECT name, setting from pg_settings where name like 'pg_store_plans%';
            name             | setting
-----------------------------+---------
 pg_store_plans.log_analyze  | off
 pg_store_plans.log_buffers  | off
 pg_store_plans.log_timing   | off
 pg_store_plans.log_triggers | off
 pg_store_plans.log_verbose  | off
 pg_store_plans.max          | 1000
 pg_store_plans.min_duration | 0
 pg_store_plans.plan_format  | text
 pg_store_plans.save         | off
 pg_store_plans.track        | all
(10 rows)
Benchmarking execution plans using pgbench
You can use your own benchmark data or the pgbench program to do specific benchmarks for you.
Create a new database (e.g. plans) that we will set up benchmarks for:
sudo -u postgres psql -c "CREATE DATABASE plans;"
So we will use this plans database to initiate pgbench:
sudo -u postgres pgbench -i plans
This initialization command will create four tables (pgbench_accounts, pgbench_branches, pgbench_history, and pgbench_tellers) and generate data for each. Next, you can run the pgbench program with the following:
sudo -u postgres pgbench -c10 -t300 plans
This will simulate running the queries by 10 clients with 300 transactions by each client.
Sample output of pg_store_plans extension
Now, let’s see in action what the pg_store_plans module can provide us with information about execution plans.
You can run the following query:
SELECT plan,
       queryid_stat_statements,
       calls,
       rows,
       total_time / 1000 AS total_time_in_seconds,
       max_time / 1000 AS max_time_in_seconds,
       stddev_time / 1000 AS staddev_time_in_seconds
FROM pg_store_plans
ORDER BY total_time DESC
LIMIT 5;
which outputs the following in my case:
-[ RECORD 1 ]-----------+----------------------------------------------------------
-------------------------------------------
plan                    | Update on pgbench_branches  (cost=0.00..8.01 rows=1 width
=370)                                      +
                        |   ->  Seq Scan on pgbench_branches  (cost=0.00..8.01 rows
=1 width=370)                              +
                        |         Filter: (bid = 1)
queryid_stat_statements | 702631482996802754
calls                   | 3000
rows                    | 3000
total_time_in_seconds   | 172.82864769599936
max_time_in_seconds     | 1.07395736
staddev_time_in_seconds | 0.057788041500530164
-[ RECORD 2 ]-----------+----------------------------------------------------------
-------------------------------------------
plan                    | Update on pgbench_tellers  (cost=0.14..8.15 rows=1 width=
1)                                         +
                        |   ->  Index Scan using pgbench_tellers_pkey on pgbench_te
llers  (cost=0.14..8.15 rows=1 width=358)  +
                        |         Index Cond: (tid = 8)
queryid_stat_statements | 4549564210735708557
calls                   | 2632
rows                    | 2632
total_time_in_seconds   | 121.37623609399988
max_time_in_seconds     | 0.542045733
staddev_time_in_seconds | 0.07123819169931028
-[ RECORD 3 ]-----------+----------------------------------------------------------
-------------------------------------------
plan                    | Update on pgbench_tellers  (cost=0.00..5.63 rows=1 width=
1)                                         +
                        |   ->  Seq Scan on pgbench_tellers  (cost=0.00..5.63 rows=1 width=358)                               +
                        |         Filter: (tid = 2)
queryid_stat_statements | 4549564210735708557
calls                   | 368
rows                    | 368
total_time_in_seconds   | 20.58186737300001
max_time_in_seconds     | 1.229732483
staddev_time_in_seconds | 0.1203638227525506
-[ RECORD 4 ]-----------+-----------------------------------------------------------------------------------------------------
plan                    | Update on pgbench_accounts  (cost=0.29..8.31 rows=1 width=103)                                      +
                        |   ->  Index Scan using pgbench_accounts_pkey on pgbench_accounts  (cost=0.29..8.31 rows=1 width=103)+
                        |         Index Cond: (aid = 40579)
queryid_stat_statements | -1240914952531769323
calls                   | 3000
rows                    | 3000
total_time_in_seconds   | 0.3813401890000001
max_time_in_seconds     | 0.039300835
staddev_time_in_seconds | 0.0007419077183734213
-[ RECORD 5 ]-----------+-----------------------------------------------------------------------------------------------------
plan                    | Index Scan using pgbench_accounts_pkey on pgbench_accounts  (cost=0.29..8.31 rows=1 width=4)        +
                        |   Index Cond: (aid = 40579)
queryid_stat_statements | 2481750471036936765
calls                   | 3000
rows                    | 3000
total_time_in_seconds   | 0.09503494499999986
max_time_in_seconds     | 0.000151944
staddev_time_in_seconds | 1.0541316619842838e-05
This query lists the most 5 slowest execution plans with the following attributes:
planto indicate the optimizer’s execution plan (in text format).queryid_stat_statementsto indicate thequeryidof thepg_stat_statementsview that we will use to join both views in the next section.callsto indicate how many calls the associated plan is executed.rowsto indicate how many rows are retrieved by the statement using the plan.total_time_in_secondsto indicate how much time in seconds the associated statement takes using the plan.max_time_in_secondsto indicate the maximum time in seconds the associated statement can take using the plan.stddev_time_in_secondsto indicate how variant this statement takes in seconds using the plan.
Making use of pg_stat_statements and pg_store_plans
Joining the pg_stat_statements and pg_store_plans views can provide us with more insightful information about improving our PostgreSQL performance. First, we need to make sure to reset our usages of both views to discard all statistics gathered so far by both views:
SELECT pg_store_plans_reset();
SELECT pg_stat_statements_reset();
Then you can run the pgbench command again:
sudo -u postgres pgbench -c10 -t300 plans
Then you can use the following query to join the two views:
SELECT s.query,
       p.plan,
       s.calls AS stmt_calls,
       p.calls AS plan_calls,
       p.total_time / p.calls AS "time/call"
FROM pg_stat_statements s
JOIN pg_store_plans p ON s.queryid = p.queryid_stat_statements
ORDER BY "time/call" DESC
LIMIT 4;
which outputs the following:
-[ RECORD 1 ]----------------------------------------------------------------------------------------------------
query      | UPDATE pgbench_branches SET bbalance = bbalance + $1 WHERE bid = $2
plan       | Update on pgbench_branches  (cost=0.00..5.02 rows=1 width=370)                                      +
           |   ->  Seq Scan on pgbench_branches  (cost=0.00..5.02 rows=1 width=370)                              +
           |         Filter: (bid = 1)
stmt_calls | 3000
plan_calls | 3000
time/call  | 100.05646483866649
-[ RECORD 2 ]----------------------------------------------------------------------------------------------------
query      | UPDATE pgbench_tellers SET tbalance = tbalance + $1 WHERE tid = $2
plan       | Update on pgbench_tellers  (cost=0.14..8.15 rows=1 width=358)                                       +
           |   ->  Index Scan using pgbench_tellers_pkey on pgbench_tellers  (cost=0.14..8.15 rows=1 width=358)  +
           |         Index Cond: (tid = 7)
stmt_calls | 3000
plan_calls | 3000
time/call  | 80.58633439933337
-[ RECORD 3 ]----------------------------------------------------------------------------------------------------
query      | UPDATE pgbench_accounts SET abalance = abalance + $1 WHERE aid = $2
plan       | Update on pgbench_accounts  (cost=0.29..8.31 rows=1 width=103)                                      +
           |   ->  Index Scan using pgbench_accounts_pkey on pgbench_accounts  (cost=0.29..8.31 rows=1 width=103)+
           |         Index Cond: (aid = 87861)
stmt_calls | 3000
plan_calls | 3000
time/call  | 0.9252829853333334
-[ RECORD 4 ]----------------------------------------------------------------------------------------------------
query      | select pg_stat_statements_reset()
plan       | Result  (cost=0.00..0.01 rows=1 width=4)
stmt_calls | 1
plan_calls | 1
time/call  | 0.332024
This query retrieves the top 4 queries that have the highest time-call ratio. Each query is retrieved with the associated plan, statement calls, and plan calls.
Datasentinel provides a very similar output but visualized and for each instance you’re running in your application. You’ll also have a real-time monitoring for each query with its associated execution plan. This allows you to know what slows down your database servers and which execution plan the optimizer uses to execute such query so that you can fix it.
To demonstrate this, you can use the Top Queries feature in Datasentinel:
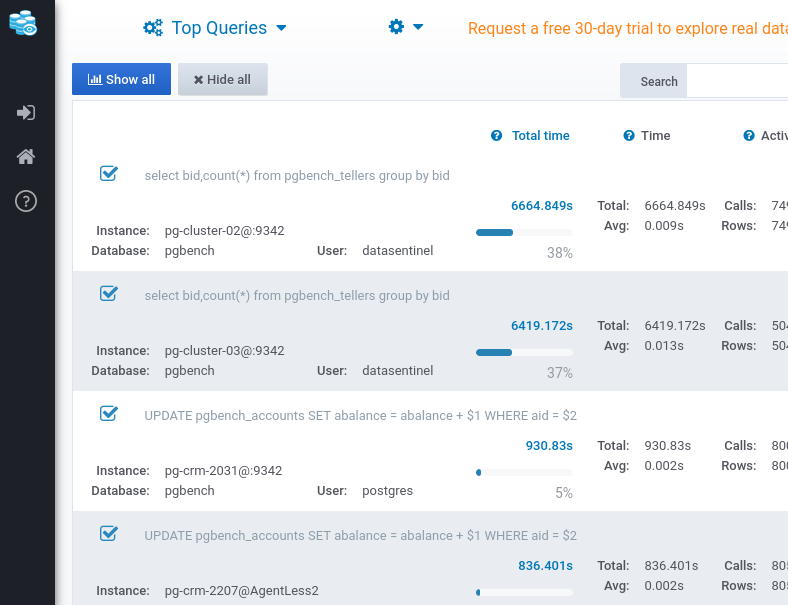
When you scroll down, you can filter the database instance that you’re interested in for tracking:
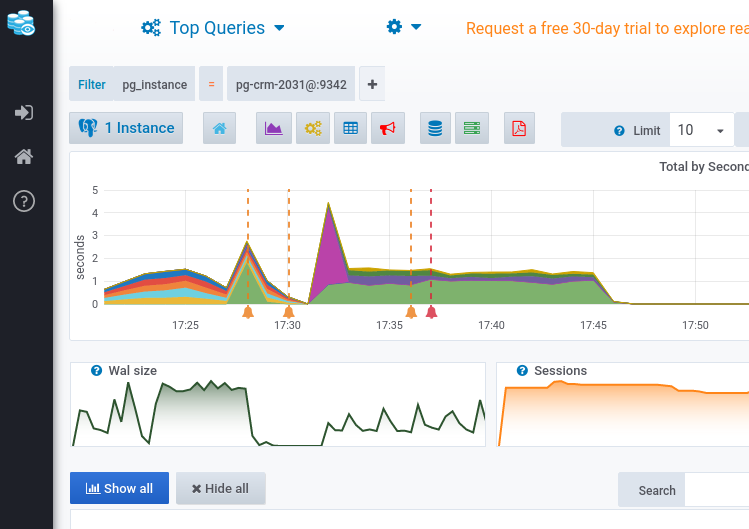
In this example, we’ve selected the CRM instance. Scrolling down again will get you all queries in that instance. Click on the query that you want to monitor and you’ll find a filter result like the following:
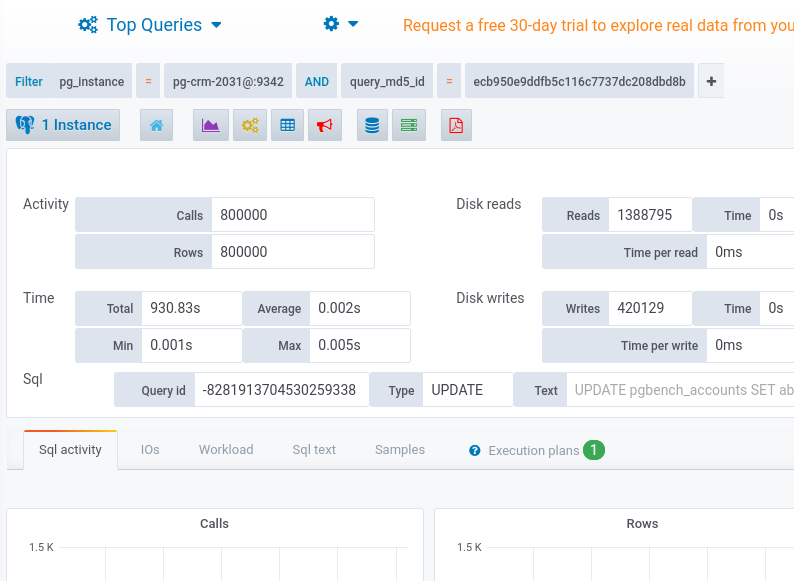
As you can see, the Sql activity tab is activated which is explained in the pg_stat_statements tutorial. Let’s click on the Execution plans tab on the right. You’ll see a breakdown like this:
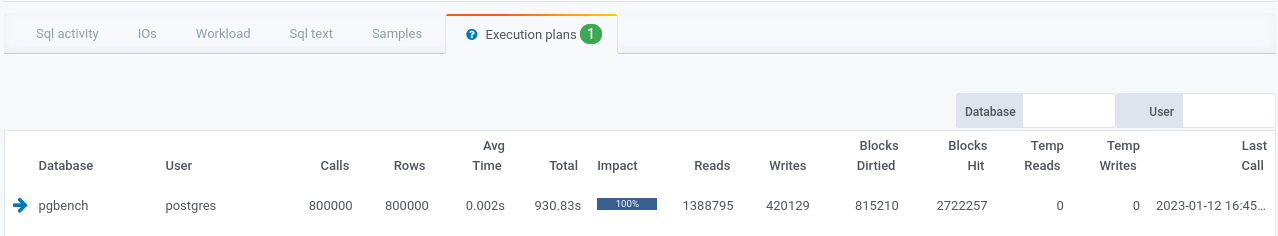
This breakdown lists all execution plans metrics associated with that query and how much each impacts the database.
If you scroll down a bit, you’ll find the plan viewer:
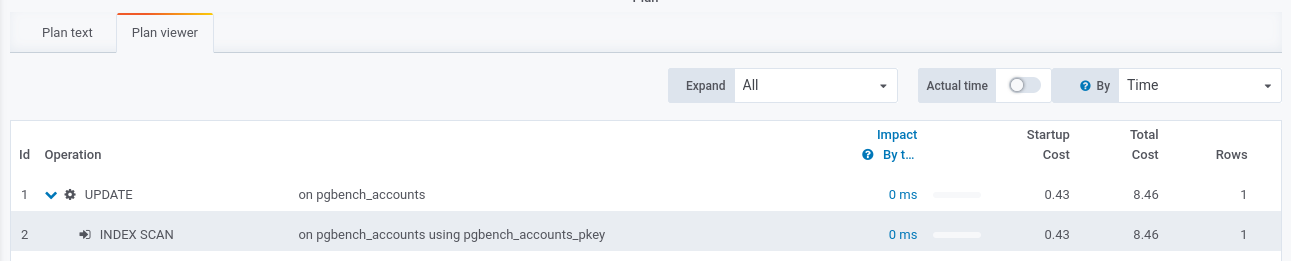
This viewer shows each step the optimizer does to scan your query. In this case, we can see it’s an index scan. If you click on the Plan text, you’ll find the execution plan as if you run the EXPLAIN command.
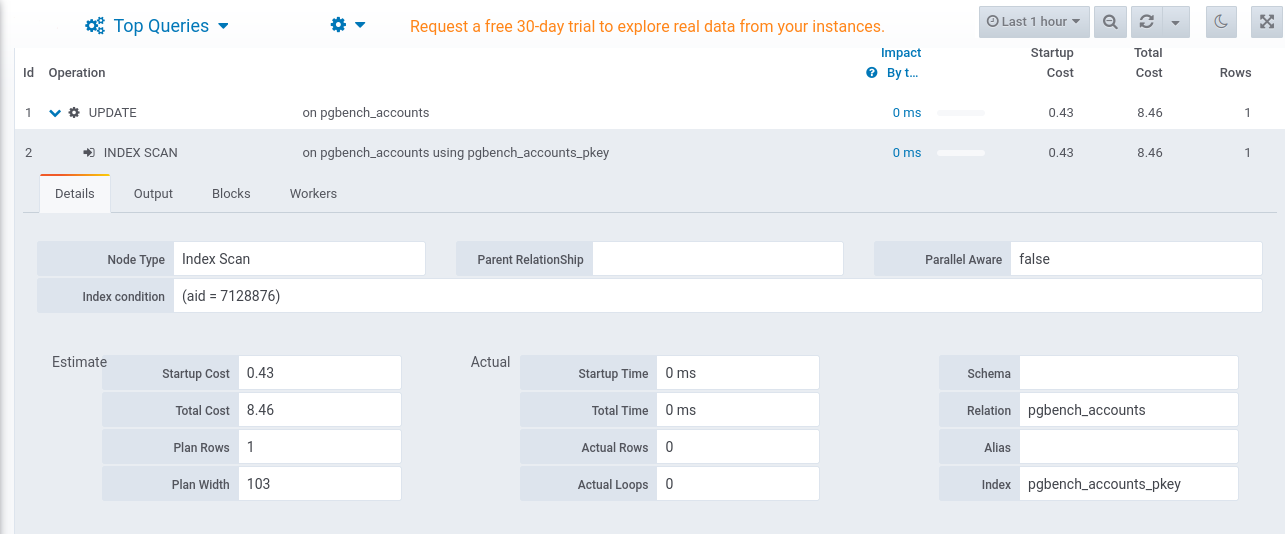
You can also have a more breakdown on each step of the execution plan. In this case, we see a breakdown of this index scan:
Conclusion
This tutorial has covered how to install pg_store_plans extension on PostgreSQL. We’ve learned how to benchmark dummy tests with certain number of clients and transactions run by each using pgbench program.
We’ve seen how to get insights about execution plans from the module and how we can join it with the pg_stat_statements to get a complete insight about PostgreSQL performance for the queries and their associated execution plans.
We’ve finally figured out how Datasentinel can help get the slowest-running queries with the associated plans, detailed metrics of each execution plan in your instances, and detailed metrics for each plan’s step; through dashboards and detailed breakdown for each metric.
This article was originally published on Datasentinel.